


Spotlight for Career Services Professionals
Spotlight for Recruiting Professionals
An examination of the data from NACE’s 2019 Student Survey shows that statistically significant disproportionalities exist in terms of race-ethnicity and representation by internship attainment and pay type.
NACE examined the representation of different demographic groups within three categories: those who never had an internship, those who engaged in an unpaid internship, and those who engaged in a paid internship. The results of this analysis provide evidence of disproportionality in internship attainment based on a nationwide sample of 3,952 graduating seniors from the Class of 2019.
Using the overall sample of graduating seniors in NACE’s dataset as the “population,” 71 percent of respondents were white, but they made up 74 percent of paid interns. (See Figure 1.) That difference reflects disproportional representation as white students were overrepresented as paid interns. Meanwhile, Black students were 6.6 percent of the sample, but represented only 6 percent of paid interns, which is statistically significant underrepresentation.
Statistical significance is an important concept in disproportionality research. Granted, 6.6 is a different number than 6.0, but statistical significance means that the difference is big enough that the difference is real and true, and not just due to random chance.
With the size of NACE’s sample in the survey, the difference between 6.6 and 6.0 in this case was statistically significant. On the other hand, Hispanic students made up 10 percent of the graduating senior population, but only 10.2 percent of unpaid interns. Though those are technically different numbers, the difference was not large enough to achieve statistical significance, which is indicated by the absence of an arrow underneath its column in the Figure 1.
The red and green arrows in Figure 1 show where the disproportionality exists, indicating when a group is underrepresented (red arrow) or overrepresented (green arrow). If there is no arrow underneath a column, then that demographic group is proportionally represented in that internship group. For example, international students on an F1 visa made up 2.6 percent of all graduating seniors in the survey and 2.8 percent of students who never had an internship. This difference was not large enough to achieve statistical significance, so it can be inferred that they are proportionally represented in this group and, thus, there is no arrow underneath that column.
Other observations from this analysis include that:
- White students are more likely to be paid interns than unpaid or never interns;
- African-American students are more likely to be unpaid interns;
- Asian-American students are more likely to be paid interns;
- Hispanic-American students are more likely to never have an internship than an unpaid or paid internship;
- Multi-racial Americans are more likely to be unpaid or never interns; and
- International students on F1 visas are more likely to be paid interns and are rarely unpaid.
Data from the 2019 Student Survey Report were collected from February 13, 2019, through May 1, 2019. A total of 22,371 students responded from 470 NACE-member colleges and universities. By class, 4,118 freshmen; 3,642 sophomores; 5,049 juniors; 6,475 seniors; 2,384 master’s students; and 516 doctoral students responded to the survey. The focus of the report, however, is on the experiences of the 3,952 graduating seniors who participated. In addition, this report includes in-depth analysis of the impact of students’ internships on these aspects of their transition from college to work. The 2019 Student Survey Report is available free to colleges that participated in the survey through MyNACE. An executive summary of the report is available through the NACE Store.
Figure 1: Interns, Race-Ethnicity
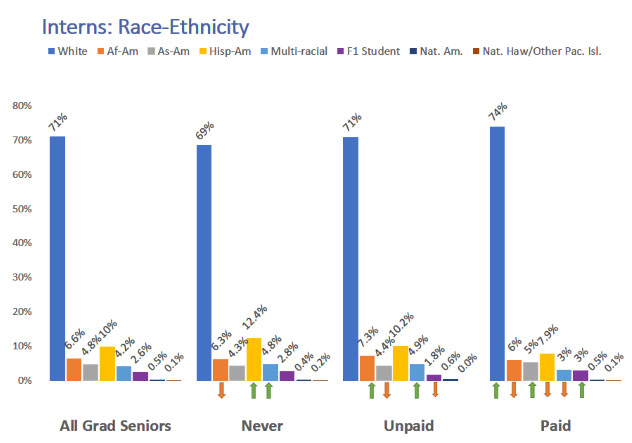
Source: 2019 Student Survey, National Association of Colleges and Employers